Stats section
Show beautiful stats for your site or shop: revenues, orders, likes, views, etc.
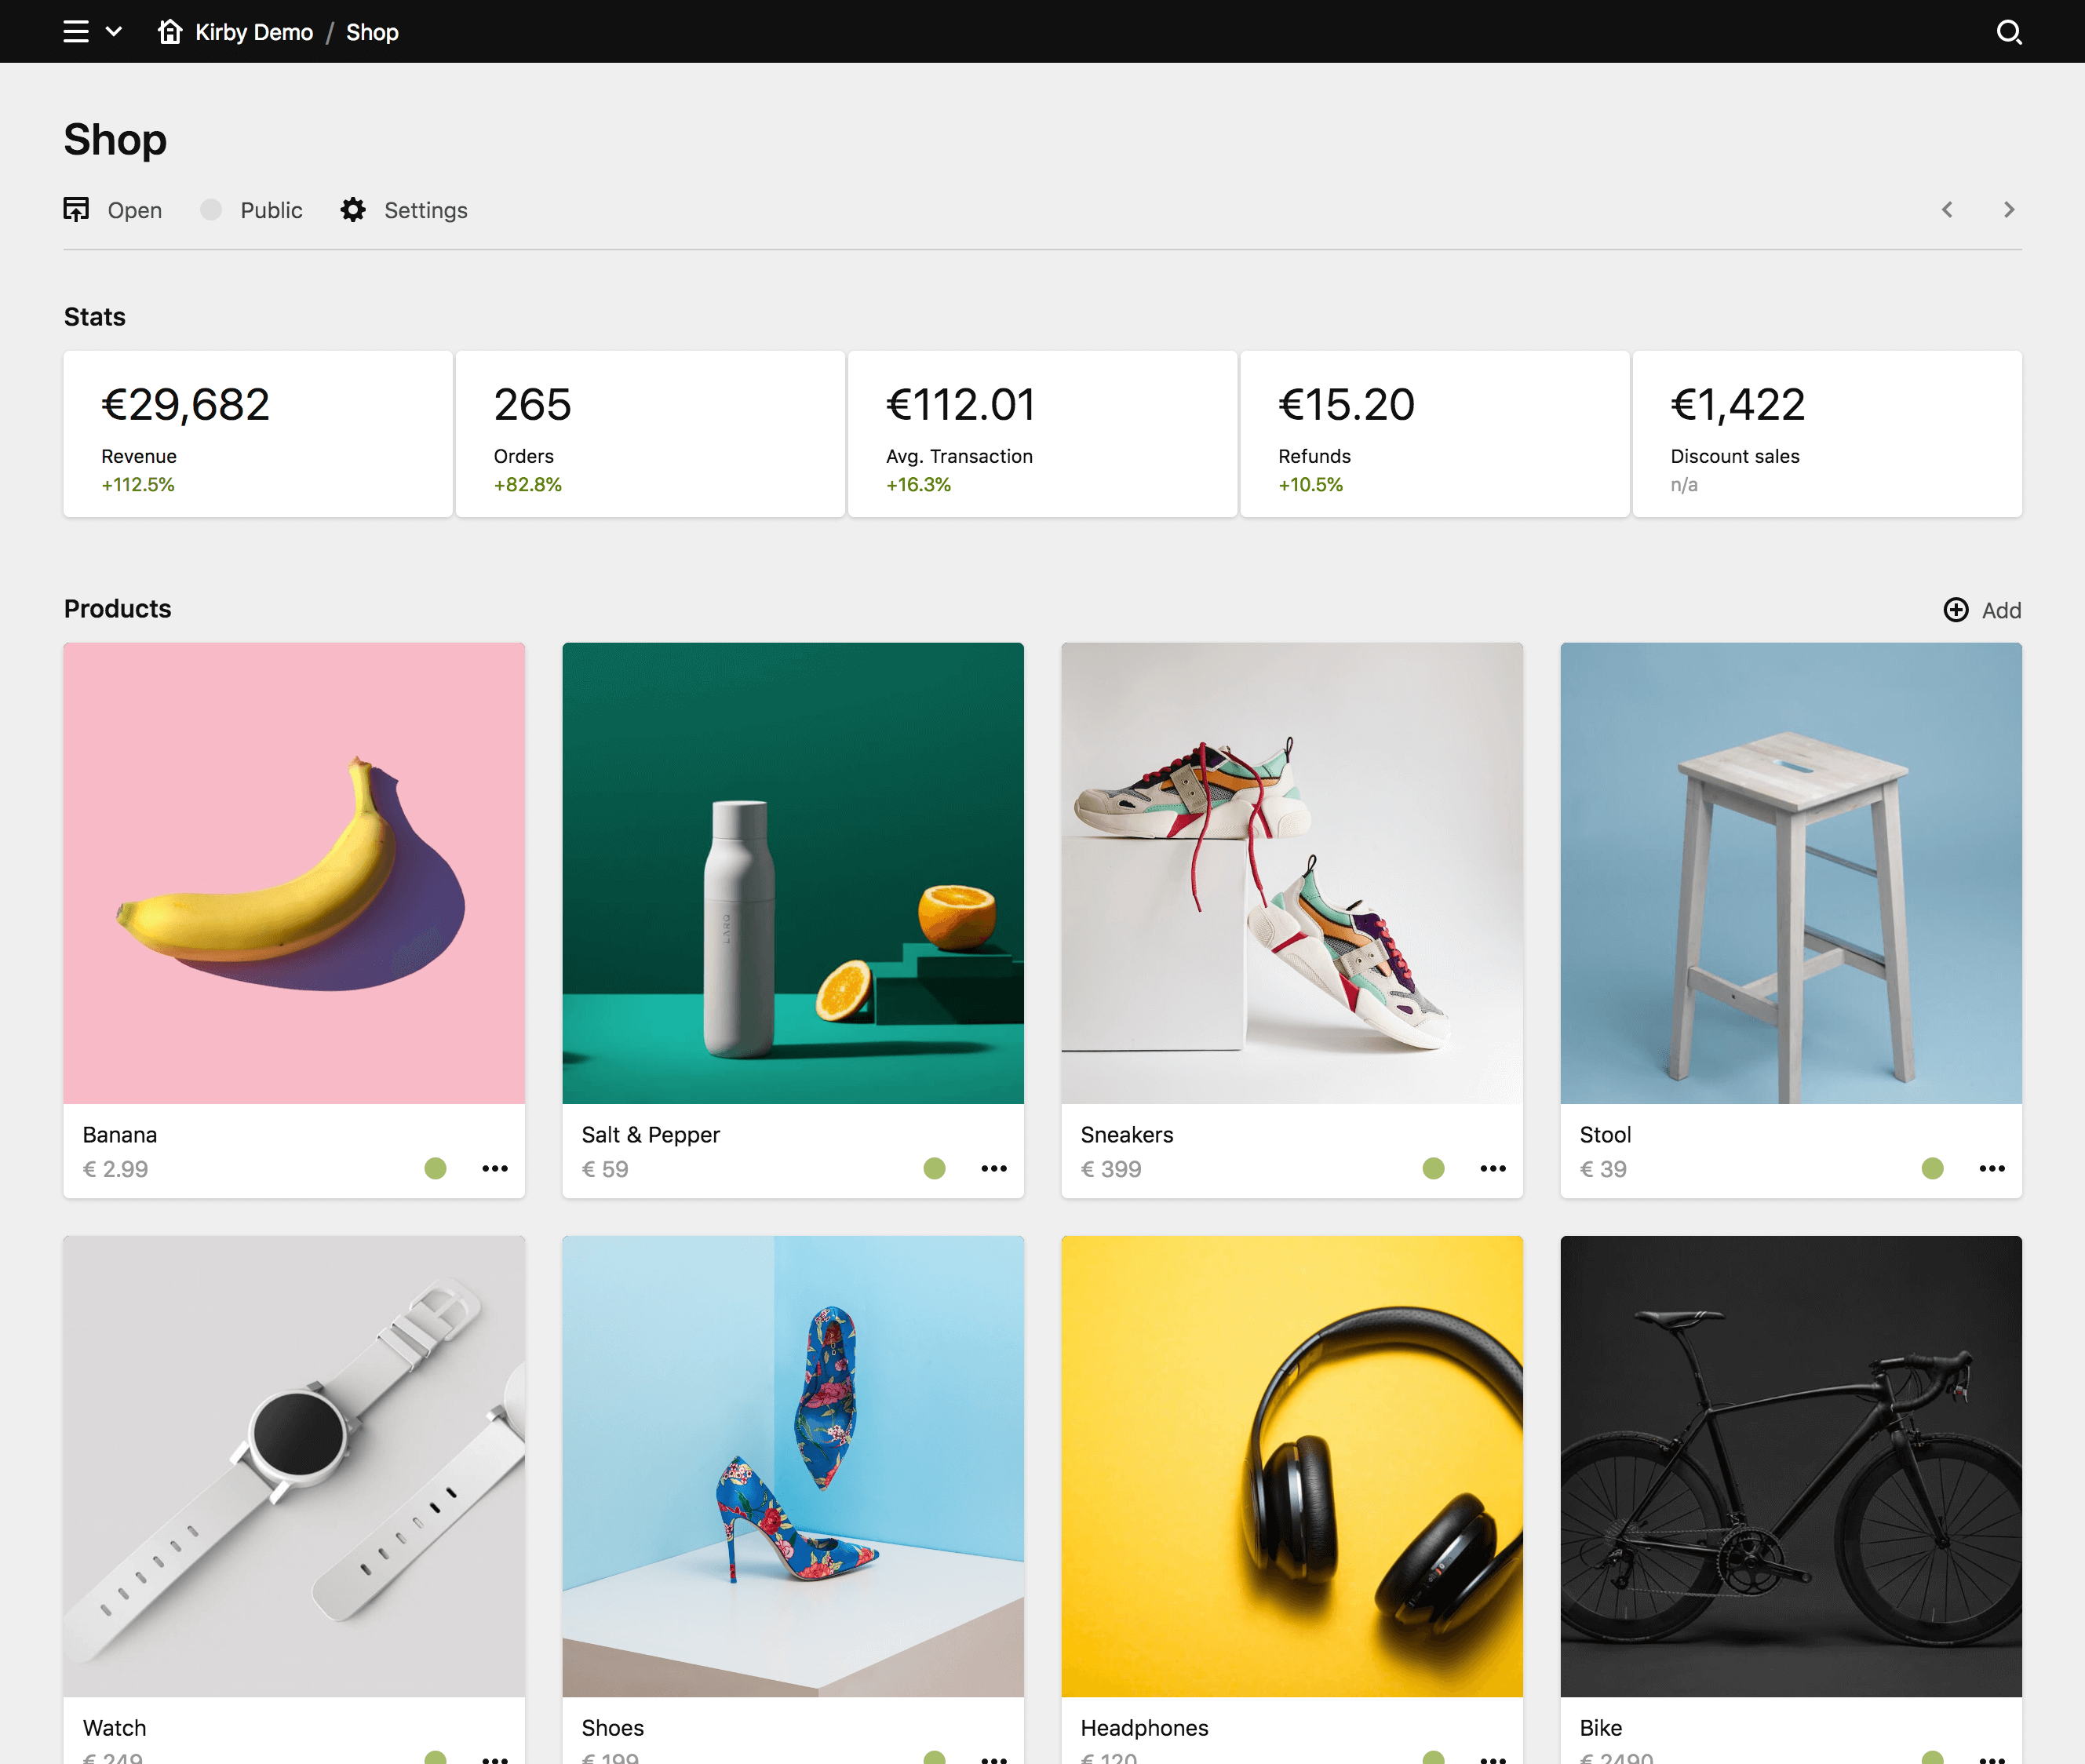
Example
title: Shop
sections:
  stats:
    type: stats
    # Available size options: small, medium, large, huge. Default is large
    size: huge
    reports:
      - label: Revenue
        value: €29,682
        info: +112.5%
        link: https://getkirby.com/shop
        theme: positive
      - label: Orders
        value: 265
        info: +82.8%
        theme: positive
      - label: Avg. Transaction
        value: €112.01
        info: +16.3%
        theme: positive
      - label: Refunds
        value: €15.20
        info: +10.5%
        theme: positive
      - label: Discount sales
        value: €1,422
        info: n/a
Section shortcuts
For simple sections that are only used once per blueprint, you can use shortcuts. In its most basic form, a stats section consists of the section type as name, and the reports property with the information you want to show.
sections:
  stats:
    reports: ...
Keep in mind that the same section name can only be used once per blueprint.
Section properties
| Name | Type | Default | Description |
|---|---|---|---|
| headline | – | The headline for the section. This can be a simple string or a template with additional info from the parent page. | |
| label | – | The label for the section. This can be a simple string or a template with additional info from the parent page. | |
| reports | – | Array or query string for reports. Each report needs a label and value and can have additional info, link and theme settings. |
|
| size | string |
large |
The size of the report cards. Available sizes: tiny, small, medium, large
|
Reports
You can add as many reports to your stats section as needed. Each report can be customized to fit your data.
Label & Value
Each report must have a label and value
stats:
  type: stats
  reports:
    - label: Revenue
      value: €29,682
Info
The info text is shown below the value and is optional. It can be fully customized.
stats:
  type: stats
  reports:
    - label: Revenue
      value: €29,682
      info: +112.5%
Links
Reports can have a link to a source or more details. Links can be absolute or relative.
stats:
  type: stats
  reports:
    - label: Revenue
      value: €29,682
      info: +112.5%
      link: /revenue
Themes
You can colorize the info value with the theme option. Available themes are:
positive(green)negative(red)notice(orange)info(blue)
stats:
  type: stats
  reports:
    - label: Revenue
      value: €29,682
      info: +112.5%
      theme: positive
Translations
All parts of a report can be translated by defininig an associative array with translations
stats:
  type: stats
  reports:
    - label:
        de: Revenue
        en: Umsatz
      value: €29,682
      info: +112.5%
Template strings
A report can be dynamic by querying data from pages, sites, collections or custom methods from plugins.
stats:
  type: stats
  reports:
    - label: Revenue
      value: "{{ page.revenue }}"
      info: "{{ page.revenueIncrease }}"
Here's a simplified example for a revenue method in a page model.
class ShopPage extends Page
{
  public function revenue(): string
  {
    return '€29,682'
  }
}
Queries
You can also generate an entire report in a page method for example and return an associative array with the report parts (label, value, info, theme, link). This will add extra flexibility and you can use logic in your methods to create dynamic reports.
stats:
  type: stats
  reports:
    - page.revenueReport
    - page.ordersReport
    - page.discountsReport
Here's an example for the custom page method in a shop page model to create the revenue report.
class ShopPage extends Page
{
  public function revenueReport(): array
  {
    return [
      'label' => 'Revenue',
      'value' => // calculate revenue here
    ];
  }
}
Instead of querying individual reports, you can also query the entire report array at once:
stats:
  type: stats
reports: page.reportsclass ShopPage extends Page
{
public function reports(): array
{
return [
[
'label' => 'Revenue',
'value' => // calculate revenue here
],
[
'label' => 'Orders',
'value' => // count orders
],
];
}
}Size
The size option controls the size of the report cards.
Available sizes:
tinysmallmediumlargehuge